Knowledge Centre
BETA VS. RETURN
August 2019
Diversification by spreading monies across multiple asset classes is the cornerstone of modern investment theory. If investors choose the right classes then they can limit potential losses without compromising potential gains. In this era of high volatility, investors are constantly looking at different parameters such as earnings per share growth rate, debt to equity, or price to earnings ratios. Most investors are obviously reluctant to incur losses and consequently choose low volatility investments. Others take on additional risk with the expectation of increased reward. Yet in this topsy-turvy world of investing the rational choice does not always work out. Therefore, it is important that investors not only have a good understanding of their risk tolerance but must also know which investments match their risk preferences in the long run, since short term results are often random and unpredictable.


Investors can better choose those securities that meet their risk criteria by looking at Beta values, which are a measure of volatility. The overall market is assigned a Beta of 1. So, investors who are risk averse should put their money into investments with low volatility (Beta of less than 1) and those willing to take on more risk can invest in high Beta stocks. Of course, theory and actual results can deviate widely at times. Certainly, the Beta of a stock can change over time due to the relative rates of return of the stock to the index.
At the same time, sector analysis involves the identification and analysis of various industries that are likely to exhibit superior performance. Studies show that the health of a stock's sector is important to the performance of the stock itself. In other words, even the best stock in a weak sector will often perform poorly. Learning more about the industry can provide a better understanding of a company.
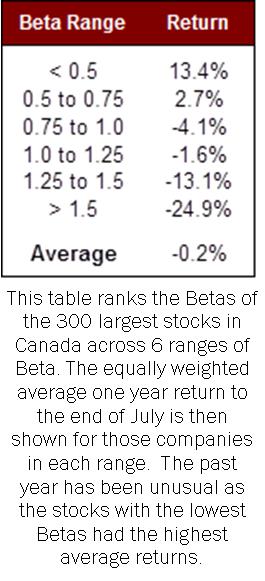
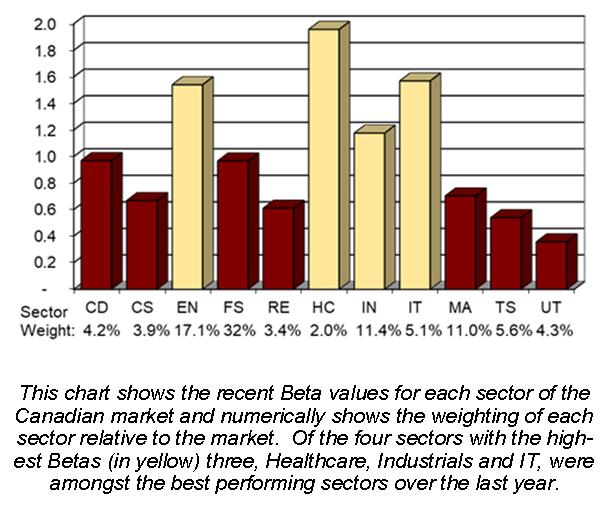
In Canada, the Beta for the eleven stock sectors can change over a business cycle. Investors can use a sector’s Beta when making short term decision where price volatility is important. As the chart to the right illustrates, four sectors (shown in yellow) currently have Beta’s above the market neutral position: Energy, Healthcare (due to large weight of marijuana stocks), Industrials and IT. While three of four sectors have outperformed the Canadian stock markets return (excluding the impact of dividends) of -0.2% for the year ending July 2019 (Healthcare, Industrials and IT), unfortunately the bulk of the gains can be attributed to just 2 to 3 stocks in each case. So, miss out on those few stocks and you would have lost money. In fact, as the table to the left shows, generally only low Beta stocks consistently gained in value over the past year. That is just how the last year has gone – riskier assets suffered losses while conservative ones prevailed.
Economic activity is cyclical. When economies are expanding, companies whose profits are sensitive to growth do best. In a slowdown the reverse is true. Although economic cycles tend to be similar there is usually a twist. Often company valuations can rise dramatically, reflecting high growth prospects. Eventually all booms revert to a bust phase. Often these formerly high performing sectors will start a stock bear market. These factors help explain why markets tend to be led by different sectors and no one industry performs well all the time. High beta sectors have a history of rising more during bullish phases and falling more in bearish phases, as we can clearly see.
Beta analysis is a useful technique that can help investors to achieve meaningful returns. By incorporating price volatility analysis investors can identify those securities and sectors which have been more or less volatile than the market itself and invest appropriately.
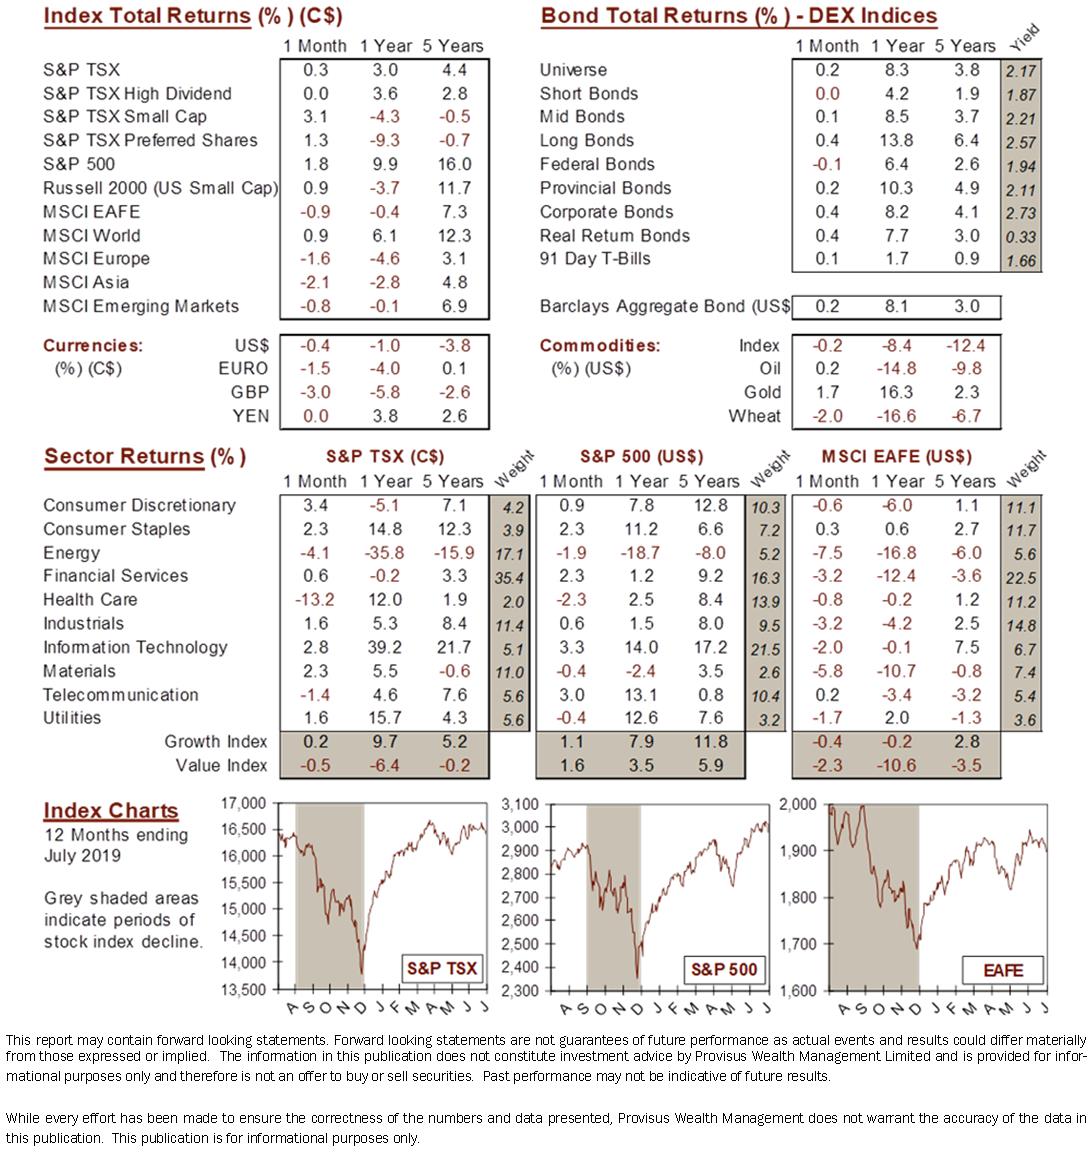
MARKET DATA

This report may contain forward looking statements. Forward looking statements are not guarantees of future performance as actual events and results could differ materially from those expressed or implied. The information in this publication does not constitute investment advice by Provisus Wealth Management Limited and is provided for informational purposes only and therefore is not an offer to buy or sell securities. Past performance may not be indicative of future results. While every effort has been made to ensure the correctness of the numbers and data presented, Provisus Wealth Management does not warrant the accuracy of the data in this publication. This publication is for informational purposes only.
Contact Us
"*" indicates required fields
18 King St. East Suite 303
Toronto, ON
M5C 1C4
