Knowledge Centre
Don’t Sell In May; Settle In
June 2017
Stock investors often hear about “sell in May and go away” around this time of year. It implies that investors should sell their stocks in early May and buy them back in late October at a lower price. Since 1968 the S&P/TSX Index has risen an average of 8.0% (including dividends) from November to April but added only 1.5% from May to October. Interestingly enough, the “sell in May and go away” phenomenon appears to be universal across international stock markets.


Investors should be cautious about trying to trade around this phenomenon though. First, you would have to get two decisions right: the sell and the buy, which is extremely difficult. Second, the negative months in Canada were not that bad in absolute terms, so buying back the stock often cost you more. And finally, there have been multiple periods with good returns during the summer months (less than half of these months had negative returns).
Besides this phenomenon should be taken with a grain of salt, since most of the weakness was triggered by unpredictable events such as: Brexit last year; the Chinese equity market meltdown in 2015; the OPEC triggered oil price collapse in 2014; the world financial market selloff in 2008; and so on. All these were summer and early fall events.
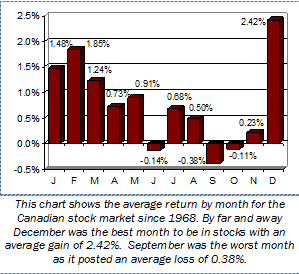
In fact the really only bad month is September which, as seen in this chart, has posted an average decline of 0.38%. Only two other months, June and October, show any average loss. September is the worst month as the market fell more than 54% of the time, while over the same 49 year period stocks have only declined 42% of the time. October, feared as the crash month, shows an average loss of 0.11%, but it is the most volatile month. At the head of the pack was December with an average gain of 2.42% which was far better than the famed January effect.
Theories for September’s weakness are abundant: there is less money flowing into investments in the latter half of the year as bonuses and tax refunds came in early and frequently go into RRSPs; investors begin to pay more attention to investments after a summer off; and psychologically, when the leaves turn, vacations end and the days get shorter, there is a tendency for impatient investors to get rid of shares they had been thinking about selling. Then again it could be no more complicated than the fact that there are only 12 months in the year and there has to be a best and a worst one. Some month had to be September.
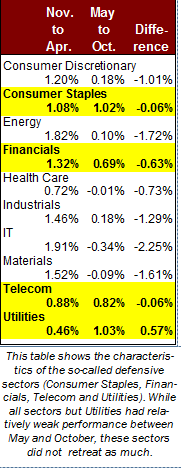
History shows investors could be better off rotating, rather than retreating. Investing in cyclical sectors (Consumer Discretionary, Energy, Health Care, Industrials, IT & Materials) from November to April and then gravitating toward defensive groups (Consumer Staples, Financials, Telecom & Utilities) from May to October could be rewarding. As the data to the left shows, the defensive stocks held up better between May and October, but only Utilities did better.
Reading too much into past trends can be a mistake however. The September market downturn is ultimately just a sort of emotional malaise. It is interesting to note that September’s negative seasonal bias is much less pronounced in years when the market is up year-to-date, as is the case this year.
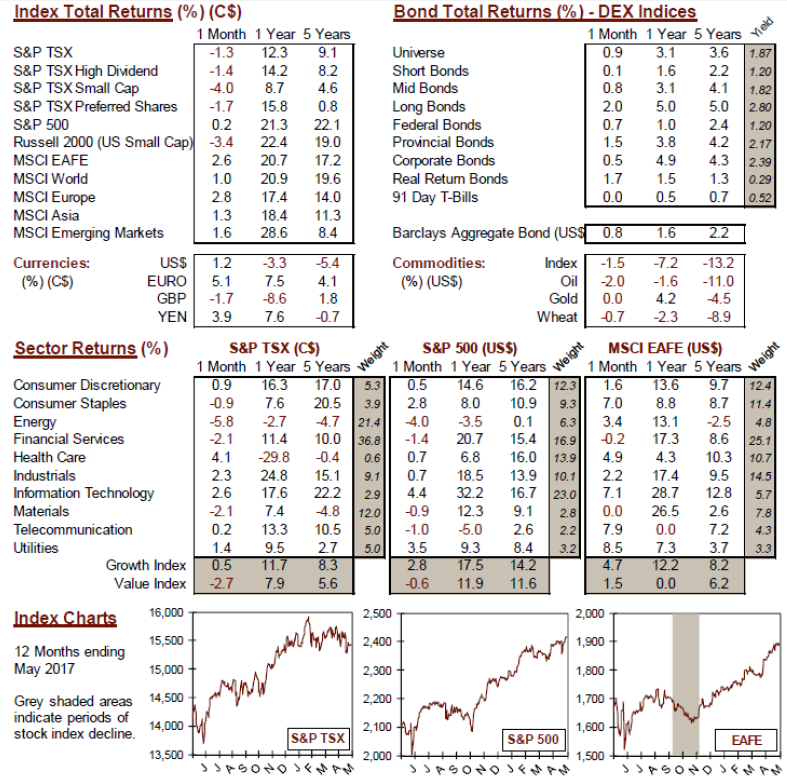
MARKET DATA

This report may contain forward looking statements. Forward looking statements are not guarantees of future performance as actual events and results could differ materially from those expressed or implied. The information in this publication does not constitute investment advice by Provisus Wealth Management Limited and is provided for informational purposes only and therefore is not an offer to buy or sell securities. Past performance may not be indicative of future results. While every effort has been made to ensure the correctness of the numbers and data presented, Provisus Wealth Management does not warrant the accuracy of the data in this publication. This publication is for informational purposes only.
Contact Us
"*" indicates required fields
18 King St. East Suite 303
Toronto, ON
M5C 1C4
