Knowledge Centre
Hiding in Average
December 2024
Conventional thinking states that stocks and bonds follow a “random walk” and no one can know in advance what the returns will be next month or next year. However, over the longer term investors can observe definite patterns once they have enough information. Since 1970 for example, Canadian bonds represented by the DEX Universe Bond Index have generated average annual returns of 7.9%. By extrapolating this data into the future the picture would look bright for bonds. That’s the problem.


Investors who study history know that it is full of discontinuities and the future cannot be predicted by clicking and dragging from the past. If this was possible then simply extrapolating data from the previous fifty or eighty years would have allowed an Englishman in 1910 to conclude that Britannia would always rule the waves; a Frenchman in 1788 to conclude that France would always be a monarchy; and an American in 2008 looking at U.S. housing data since the Second World War would conclude without a trace of embarrassment that house prices would never go down.
Reliance on “averages” can be just as dangerous. Who can disagree with the fact that the average population of Canada and China is more than 700 million people? Or the fact that Lebron James and his son are the highest scoring father/son combination in the history of basketball, averaging more that 20,000 points each; unfortunately, his son currently has only scored two of those points. Looking only at the “average” numbers can pose as many questions as answers. Relying on a small set of data can be inexact but going further back into history and using a thousand data points can be equally unreliable due to data inconsistencies. The only solution is to realize that there is no perfect solution but being aware of the path taken to arrive at the average number is valuable.
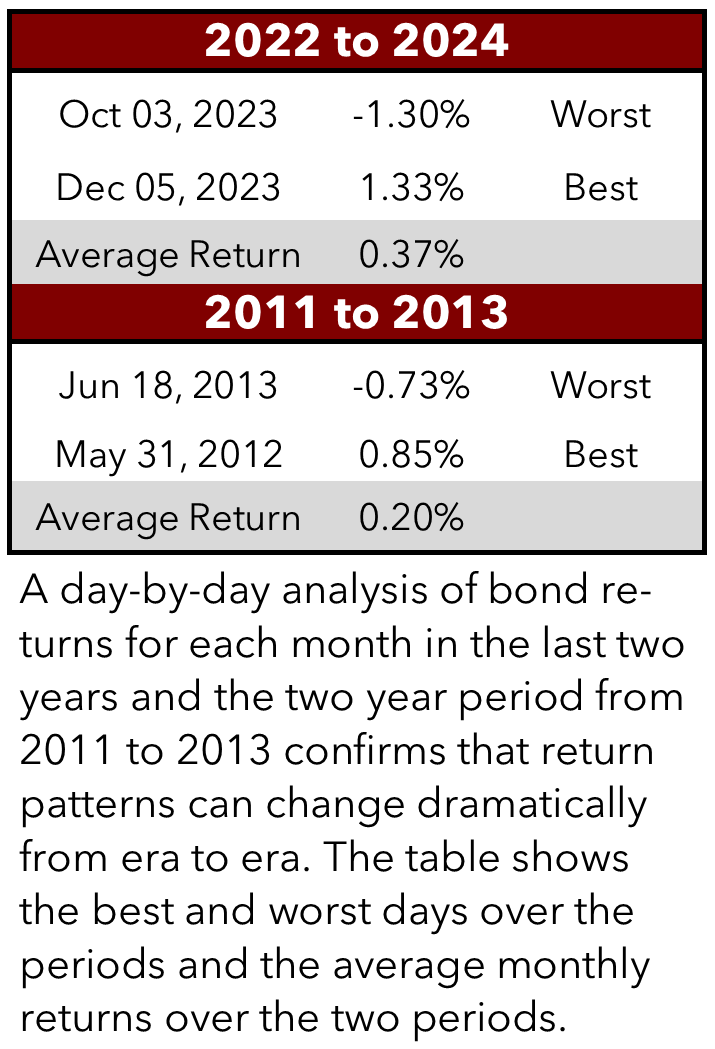
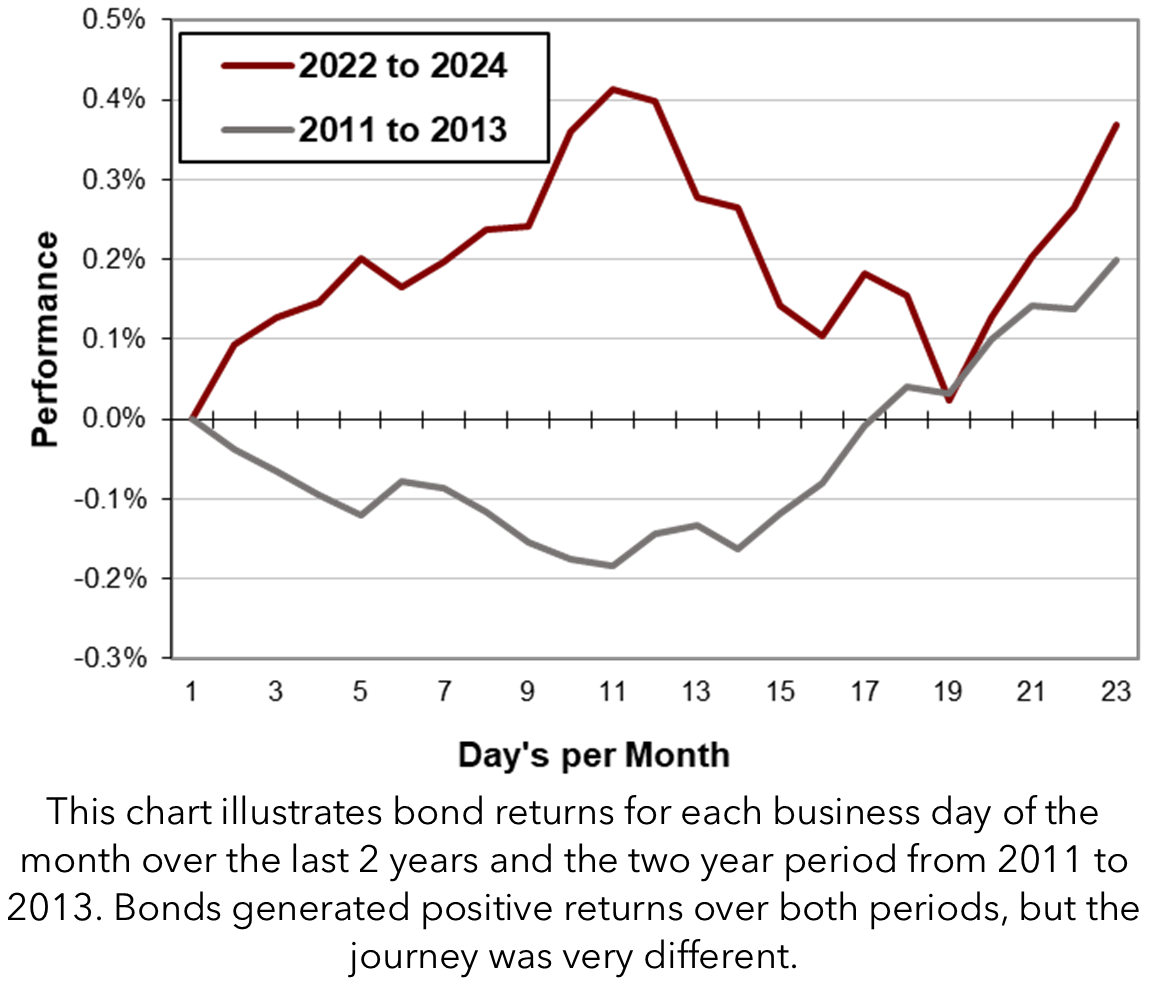
Drilling down into the finer details can show a very different picture. For example, Canadian bonds over the past two years have been mediocre performers with average annual returns of 5.8% per year, which in itself is a far cry from the 55 year historical average annual return. But as the chart above and the data to the left illustrate the path to achieving these returns was not easy. For each of the past 24 monthly periods (the maroon line), the average return followed a meandering path of gains and declines but finished the month with close to monthly highs. However, compare this with similar analysis for the period of 2011 to 2012 and you find bonds generated negative returns in the first 17 business days of each month and then eked out positive returns in the last few days of each month; that allowed the bond market to show positive performance. While both periods generated positive returns, the path taken was very different.
The conclusion is that an over analysis of data can be misleading, and investors should be aware of the big picture when making investment decisions. Life itself may involve a “random walk”, but investing is not completely random. Performance comes in waves with some periods generating good returns and others bad. The key is to identify each wave as early as possible. The bottom line for bonds is that one should not expect good returns to continue just because they have in the past. Only time will tell.
MARKET DATA

This report may contain forward looking statements. Forward looking statements are not guarantees of future performance as actual events and results could differ materially from those expressed or implied. The information in this publication does not constitute investment advice by Provisus Wealth Management Limited and is provided for informational purposes only and therefore is not an offer to buy or sell securities. Past performance may not be indicative of future results. While every effort has been made to ensure the correctness of the numbers and data presented, Provisus Wealth Management does not warrant the accuracy of the data in this publication. This publication is for informational purposes only.
Contact Us
"*" indicates required fields
18 King St. East Suite 303
Toronto, ON
M5C 1C4
