Knowledge Centre
Maximum Correlation
November 2024
Currently there is a high correlation amongst stocks around the world although that is starting to change, which historically has been a very good thing. Correlation is a statistical measure of the connection between two securities. This statistic measure tells investors how closely one set of stocks is related to another. It is positive when both securities move in the same direction, up or down. If correlation is 1.0 then this means that both of the securities move in complete unison. This indicator can also help investors diversify by identifying stocks with a low correlation to the stock market. Individual Canadian stocks have experienced correlations vs. the global stock markets that where recently very close to 90 year highs.


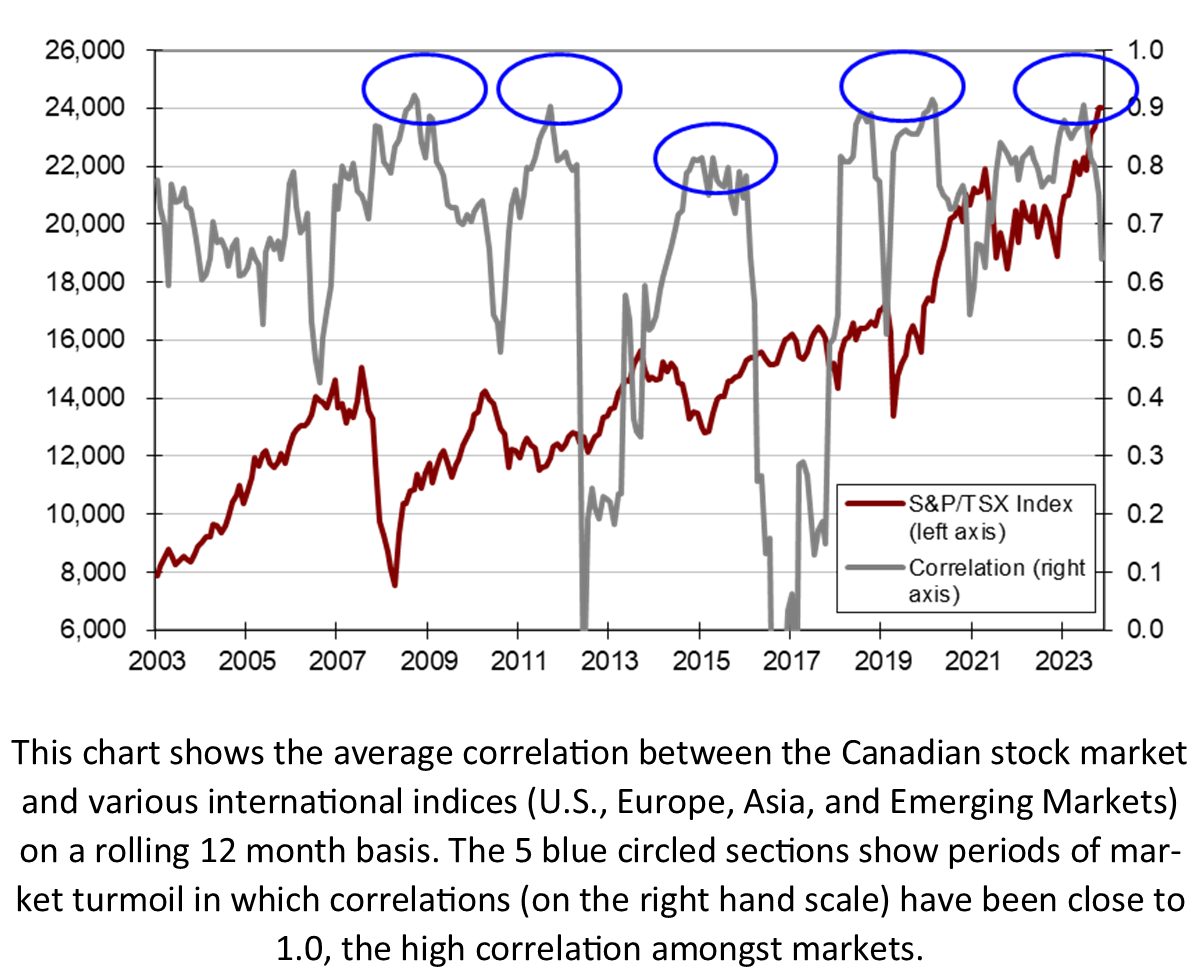
ETFs have been blamed for creating excess correlation in the equity market, but it is more likely that correlation depends on macro events and the state of the overall market than any one event. Stock correlation rises during periods of market turmoil, generally corresponding to stock market lows. Canada has seen high levels of correlation among stocks in the past that are mainly due to macro effects. During periods of high uncertainty, stock prices are largely driven by such factors as economic growth, unemployment, fiscal policy, etc. Therefore, stock prices tend to have less differentiation, leading to a high level of correlation. When there is high correlation, potential stock outperformance is reduced. Simply put, macro strategies and stock picking managers perform better when correlation is declining or low, like it is currently
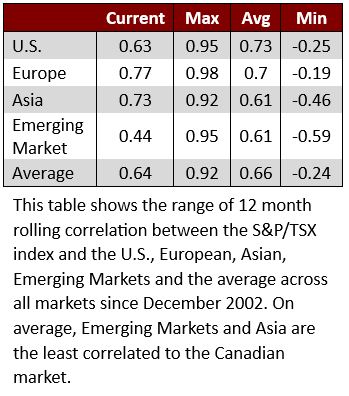
It is a fact of life for investors that in recent years the stock market has seen a dramatic rise in correlation. Surprises like what happened in 2008, 2012 and 2020 indicate the degree to which high correlations across financial markets had returned with a vengeance. The chart shows the average correlation between the Canadian stock market and various international indices (U.S., Europe, Asia, and Emerging Markets) on a rolling 12 month basis. The 5 blue circled sections show periods of market turmoil in which the world’s stock markets have moved together. This table shows the range of 12 month rolling correlation between the S&P/TSX index and the U.S., European, Asian, Emerging Markets and average across all markets; since December 2002. A crucial question for investors is how long these market dynamics will persist.
Correlation among equities tend to remain elevated, barring the removal of one or more major economic or financial market headwinds. For markets to successfully transition to a sustainable, self reinforcing phase, we need to see global correlation falling outside of the range that has prevailed since the COVID crisis began, which appears to be starting.
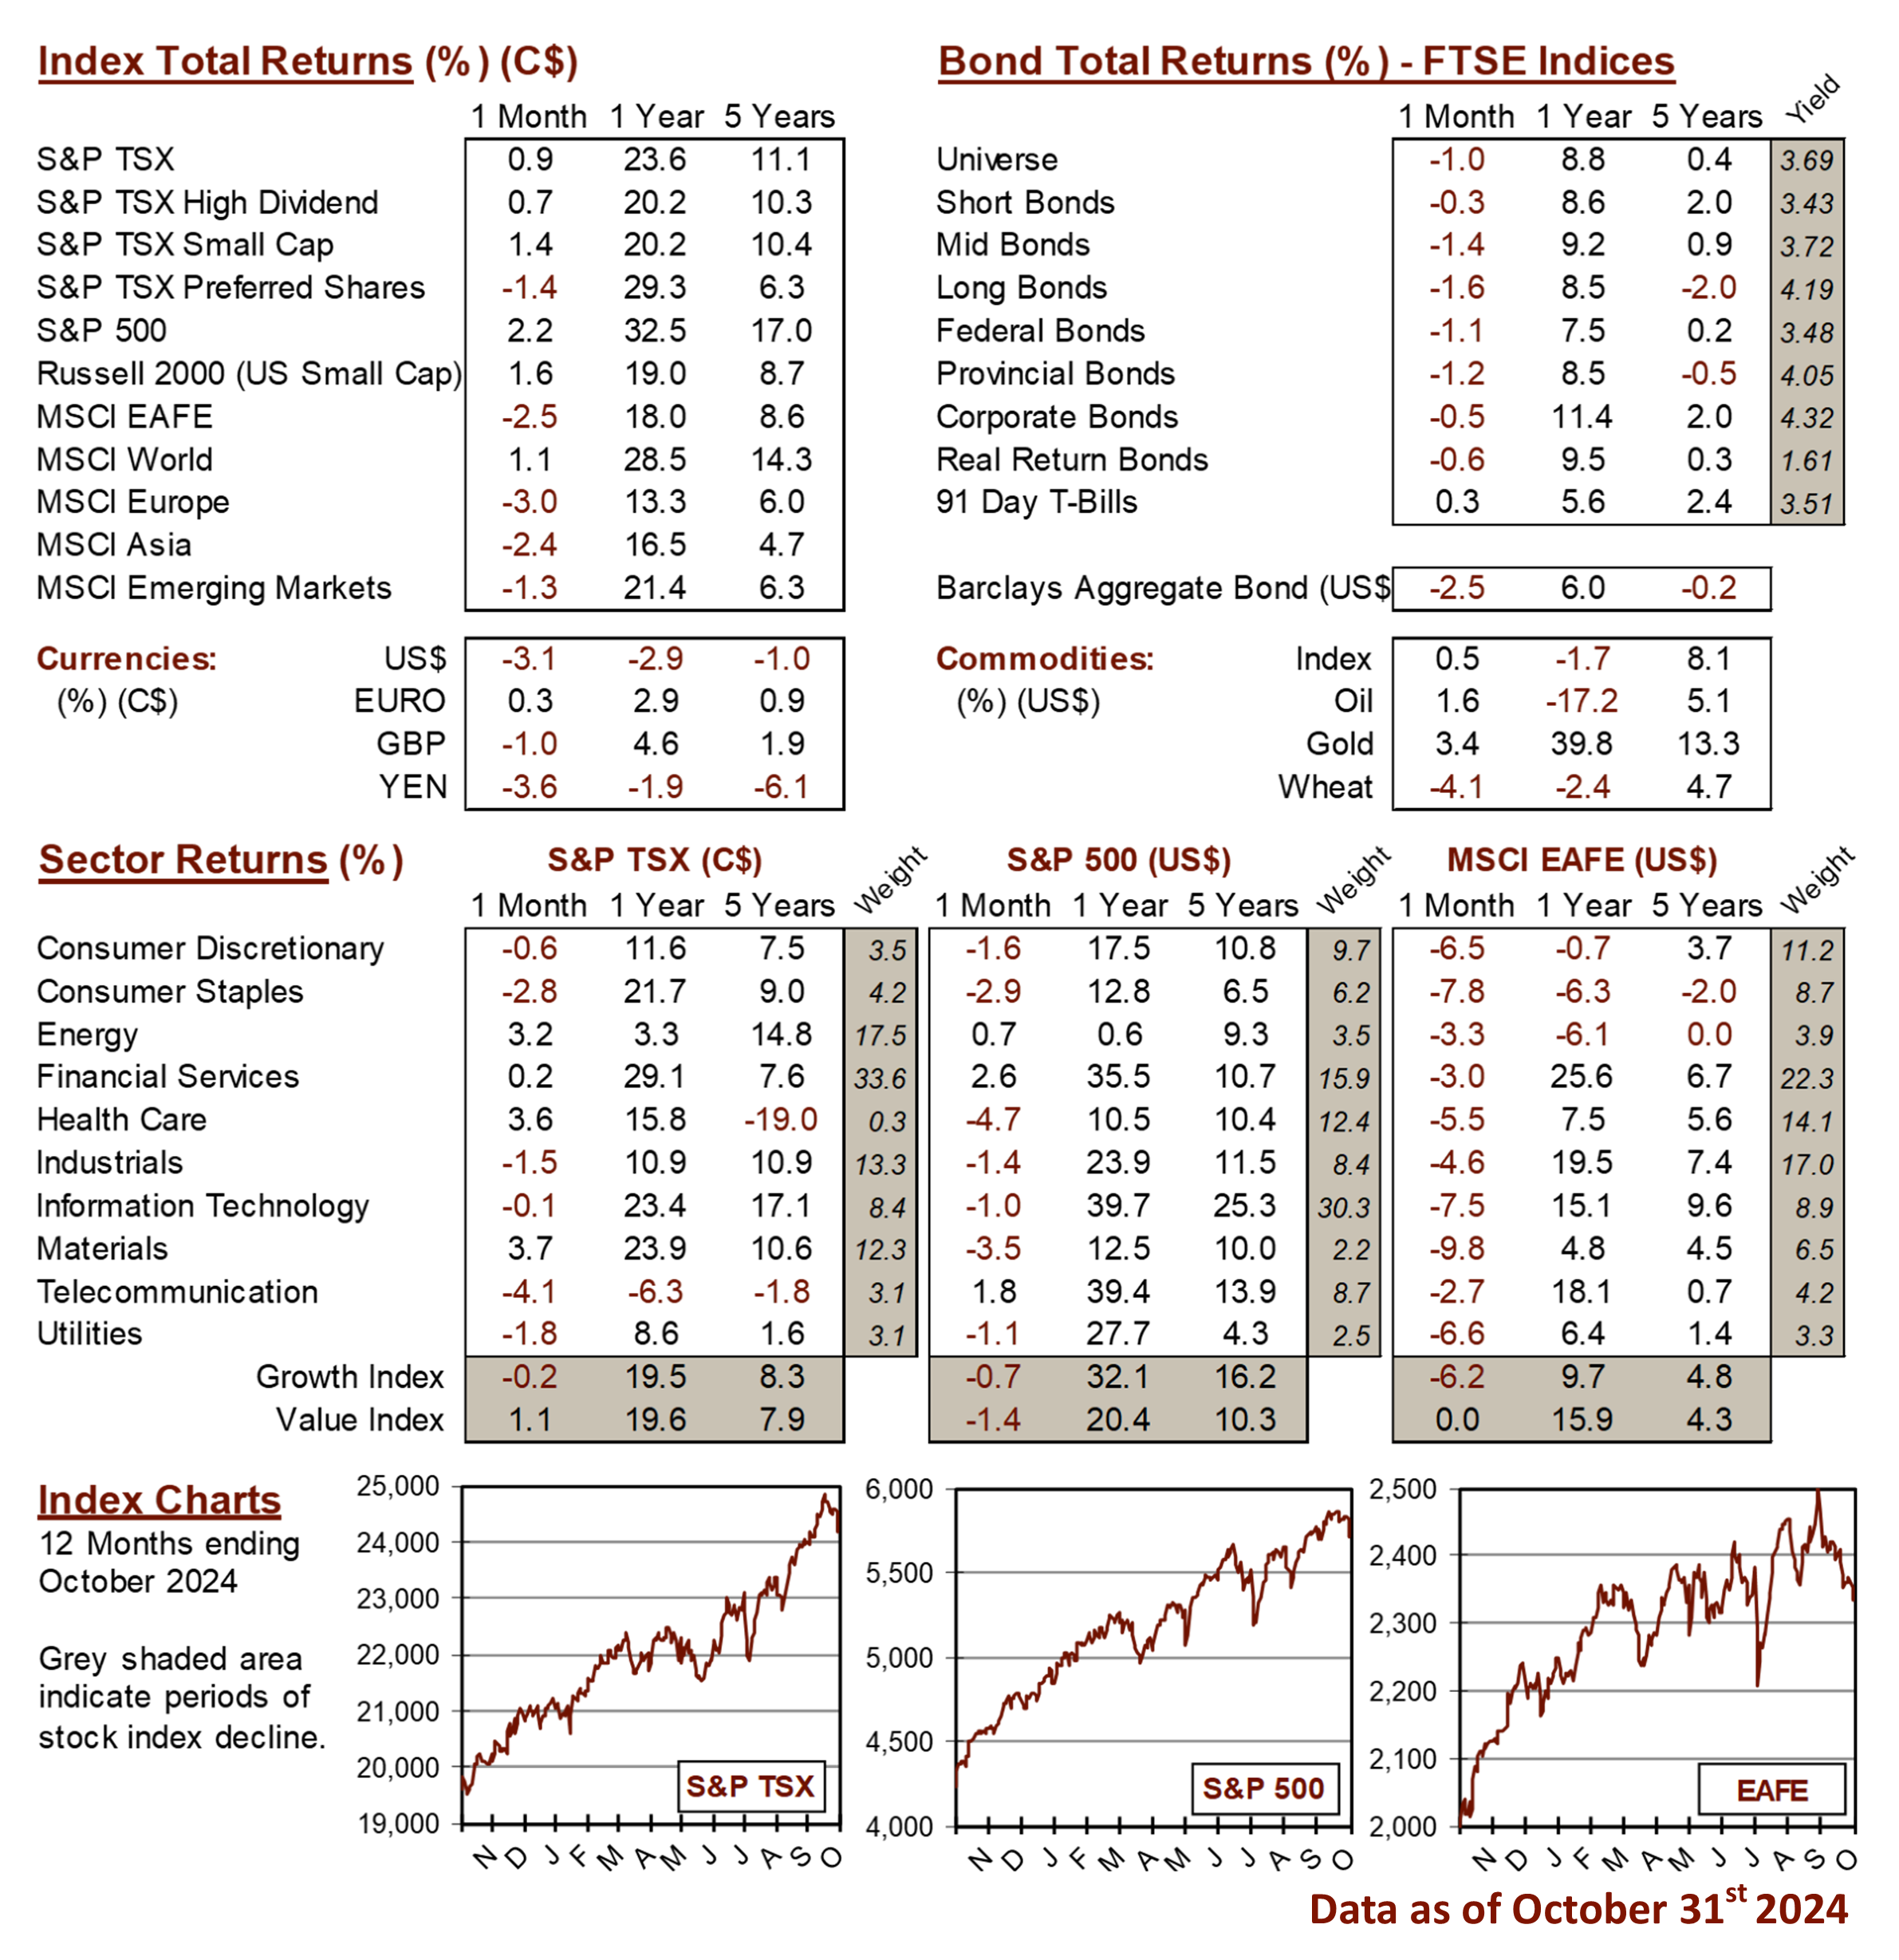
MARKET DATA

This report may contain forward looking statements. Forward looking statements are not guarantees of future performance as actual events and results could differ materially from those expressed or implied. The information in this publication does not constitute investment advice by Provisus Wealth Management Limited and is provided for informational purposes only and therefore is not an offer to buy or sell securities. Past performance may not be indicative of future results. While every effort has been made to ensure the correctness of the numbers and data presented, Provisus Wealth Management does not warrant the accuracy of the data in this publication. This publication is for informational purposes only.
Contact Us
"*" indicates required fields
18 King St. East Suite 303
Toronto, ON
M5C 1C4
