Knowledge Centre
SPOOKY PERFORMANCE
November 2019
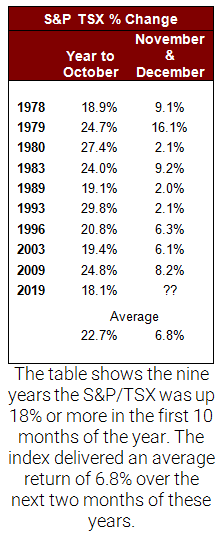
While Halloween season may have passed, investors could be in for some very spooky performance going forward. Historically, when January to October has been good for the Canadian stock market, that momentum carries forward to strong returns for the remainder of the year. Such has been the case in similar market conditions over the past 43 years. If this trend continues in 2019, returns for the November to December period could average 6.8% and should likely be no lower than 2.0%.


So far this year the markets have enjoyed a stomach-churning climb toward all-time highs, yet if this statistical trend for equity benchmarks holds up, there is much more room to grow. Historically, going back to 1976 when the S&P/TSX Composite Total Return Index (which includes dividend distributions) was up by as sizable a measure at the end of October as it is now, higher returns for the rest of the year are likely. In fact, returns from November to December in those years have been remarkably stellar.
Specifically, as the table to the left illustrates, when the S&P/TSX is up by at least 18% in the year-to-date through the end of October, the index delivered an average return of 6.8% over the next two month period. On average, the year-to-October return of 22.7% and the average annual return was 29.5% for the nine years which reach this pinnacle. Of course, this year falls into this illustrious grouping.
To be sure, past results are absolutely no true guarantee of future returns and stocks can clearly begin edging lower amid growing worries about U.S. / China trade relations and an unfolding American impeachment inquiry. Additionally, Britain’s long-sought Brexit plan could also lead to a period of greater volatility for stocks.
Still, the average year-to-October return for the S&P/TSX Composite Total Return Index for every year since 1976 has been 6.7%; so, what has been achieved so far this year is pretty impressive. Interestingly, the last two months of the year have combined to return on average 4.0% over the entire period. While this is not in the same league as the 6.8% November-December returns during the nine years with outstanding returns ahead of this season it is still impressive.
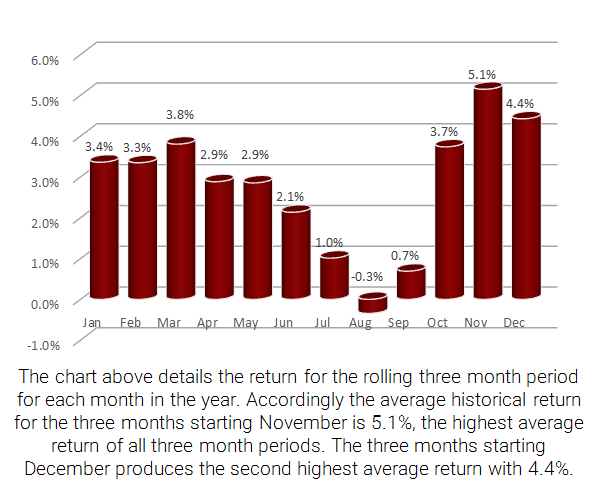
Moreover, as the chart above-right shows, historically November to January marks the start of the best three-month span for the year, with average gains for the three months starting in November of 5.1%; while the second best three-month period begins in December with 4.4%. These returns are almost twice as good as the average three-month period during the rest of the year, 2.4%.
The bottom line is that despite the seemingly unrelenting negative opinions floating around regarding stock market prospects going forward, the near term looks pretty darn good. While nothing can work 100% of the time, investors should find these odds favourable.
MARKET DATA

This report may contain forward looking statements. Forward looking statements are not guarantees of future performance as actual events and results could differ materially from those expressed or implied. The information in this publication does not constitute investment advice by Provisus Wealth Management Limited and is provided for informational purposes only and therefore is not an offer to buy or sell securities. Past performance may not be indicative of future results. While every effort has been made to ensure the correctness of the numbers and data presented, Provisus Wealth Management does not warrant the accuracy of the data in this publication. This publication is for informational purposes only.
Contact Us
"*" indicates required fields
18 King St. East Suite 303
Toronto, ON
M5C 1C4
