Knowledge Centre
Up the Escalator, Down the Elevator
September 2024
Up the Escalator, Down the Elevator is a phrase which describes the historical pattern in global central banks interest rate decisions. When the decision is made to increase interest rates, they tend to rise steadily over a long time but when they turn, they can plunge rapidly. It is equally applicable to Canadian interest rates and describes what we may be about to witness as an unusually large wave of volatility hits world markets.


The Bank of Canada’s (BOC) rate hiking cycles are often conducted gradually at a measured pace. However, this does not occur historically for easing cycles. Rate cuts are often large, aggressive, and reactive because central banks are forced onto their hind legs and into frantically responding to forces spiraling out of control, like a recession or severe financial market turmoil. Or both. Because as most investors know the economy almost never enjoys the highly desired soft landing. Instead, it often faces an emergency landing. That is because lagging behind is unfortunately a much too common feature of the Bank of Canada’s process.
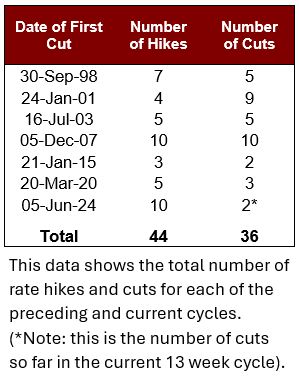
The Bank of Canada’s job is to act in a steady way, such that successful policy management appears more likely when policymakers act early, more carefully and pre-emptively. Unfortunately, despite their best intentions, the central bank’s reaction is rarely steady. Since 1996, the central bank has raised rates 44 times and cut them 36 times (as of August 2024, although there are definitely more cuts on the way). This may seem a little surprising given that inflation was below target for much of that time. However, rate cuts have been more aggressive than hikes, perhaps understandably in light of the dotcom crash, global financial crisis and COVID-19 pandemic. The Bank Rate fell to virtually zero in two of those episodes and in one case it stayed there for years.
The Bank Rate has been raised by 0.25% 33 times and by 0.50% or more 6 times. Until the surge in global inflation after the pandemic and Russia’s invasion of Ukraine, the BOC had raised rates by 0.75% or more only twice, in March 1996. However, it once again undertook this feat two times in the most recent hiking cycle since March 2022. That compares with 24 cuts of 0.25%, 10 reductions of 0.50%, and 2 cuts of 0.75%.
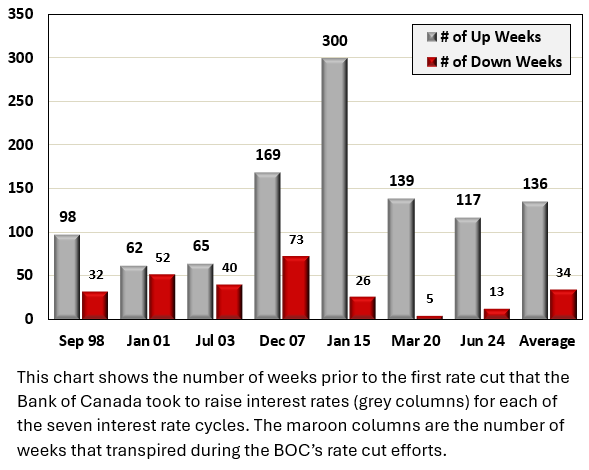
As the chart illustrates, the number of weeks prior to the first rate cut that the Bank of Canada took to raise interest rates (grey columns) for each of the seven interest rate cycles. The maroon columns are the number of weeks that transpired during the BOC’s rate cut efforts. Clearly, the timeline from the start of interest rate hikes was considerably longer (136 weeks on average), than the 34 weeks on average that it took to retrace or cut even deeper from first to last cut. The Bank of Canada essential took 4 times the amount of time to ratchet up rates, as it did to slash them. The data to the left shows the total number of hikes and cuts for each of the preceding and current cycles.
In many ways, the Bank of Canada is a victim of its own strategy. It is a data driven, consensus driven decision making organization, so it has to see the hard economic data first before it acts. Given that it often relies on lagging indicators, it is almost always behind the curve. Its challenge is to ensure that this lag is as short as possible.
It is a reactive institution with limited powers of prediction so it is better to observe than predict. Since nobody has ever shown the capacity to predict the future, there is no other alternative. As a result, they are constantly playing catch up. Stock prices are volatile and bond yields are falling rapidly now, while fear in the markets is picking up to the highest levels since 2008 and 2020. If history is a guide, rates could be slashed as in those two instances and investors could be looking out down the elevator shaft very soon.
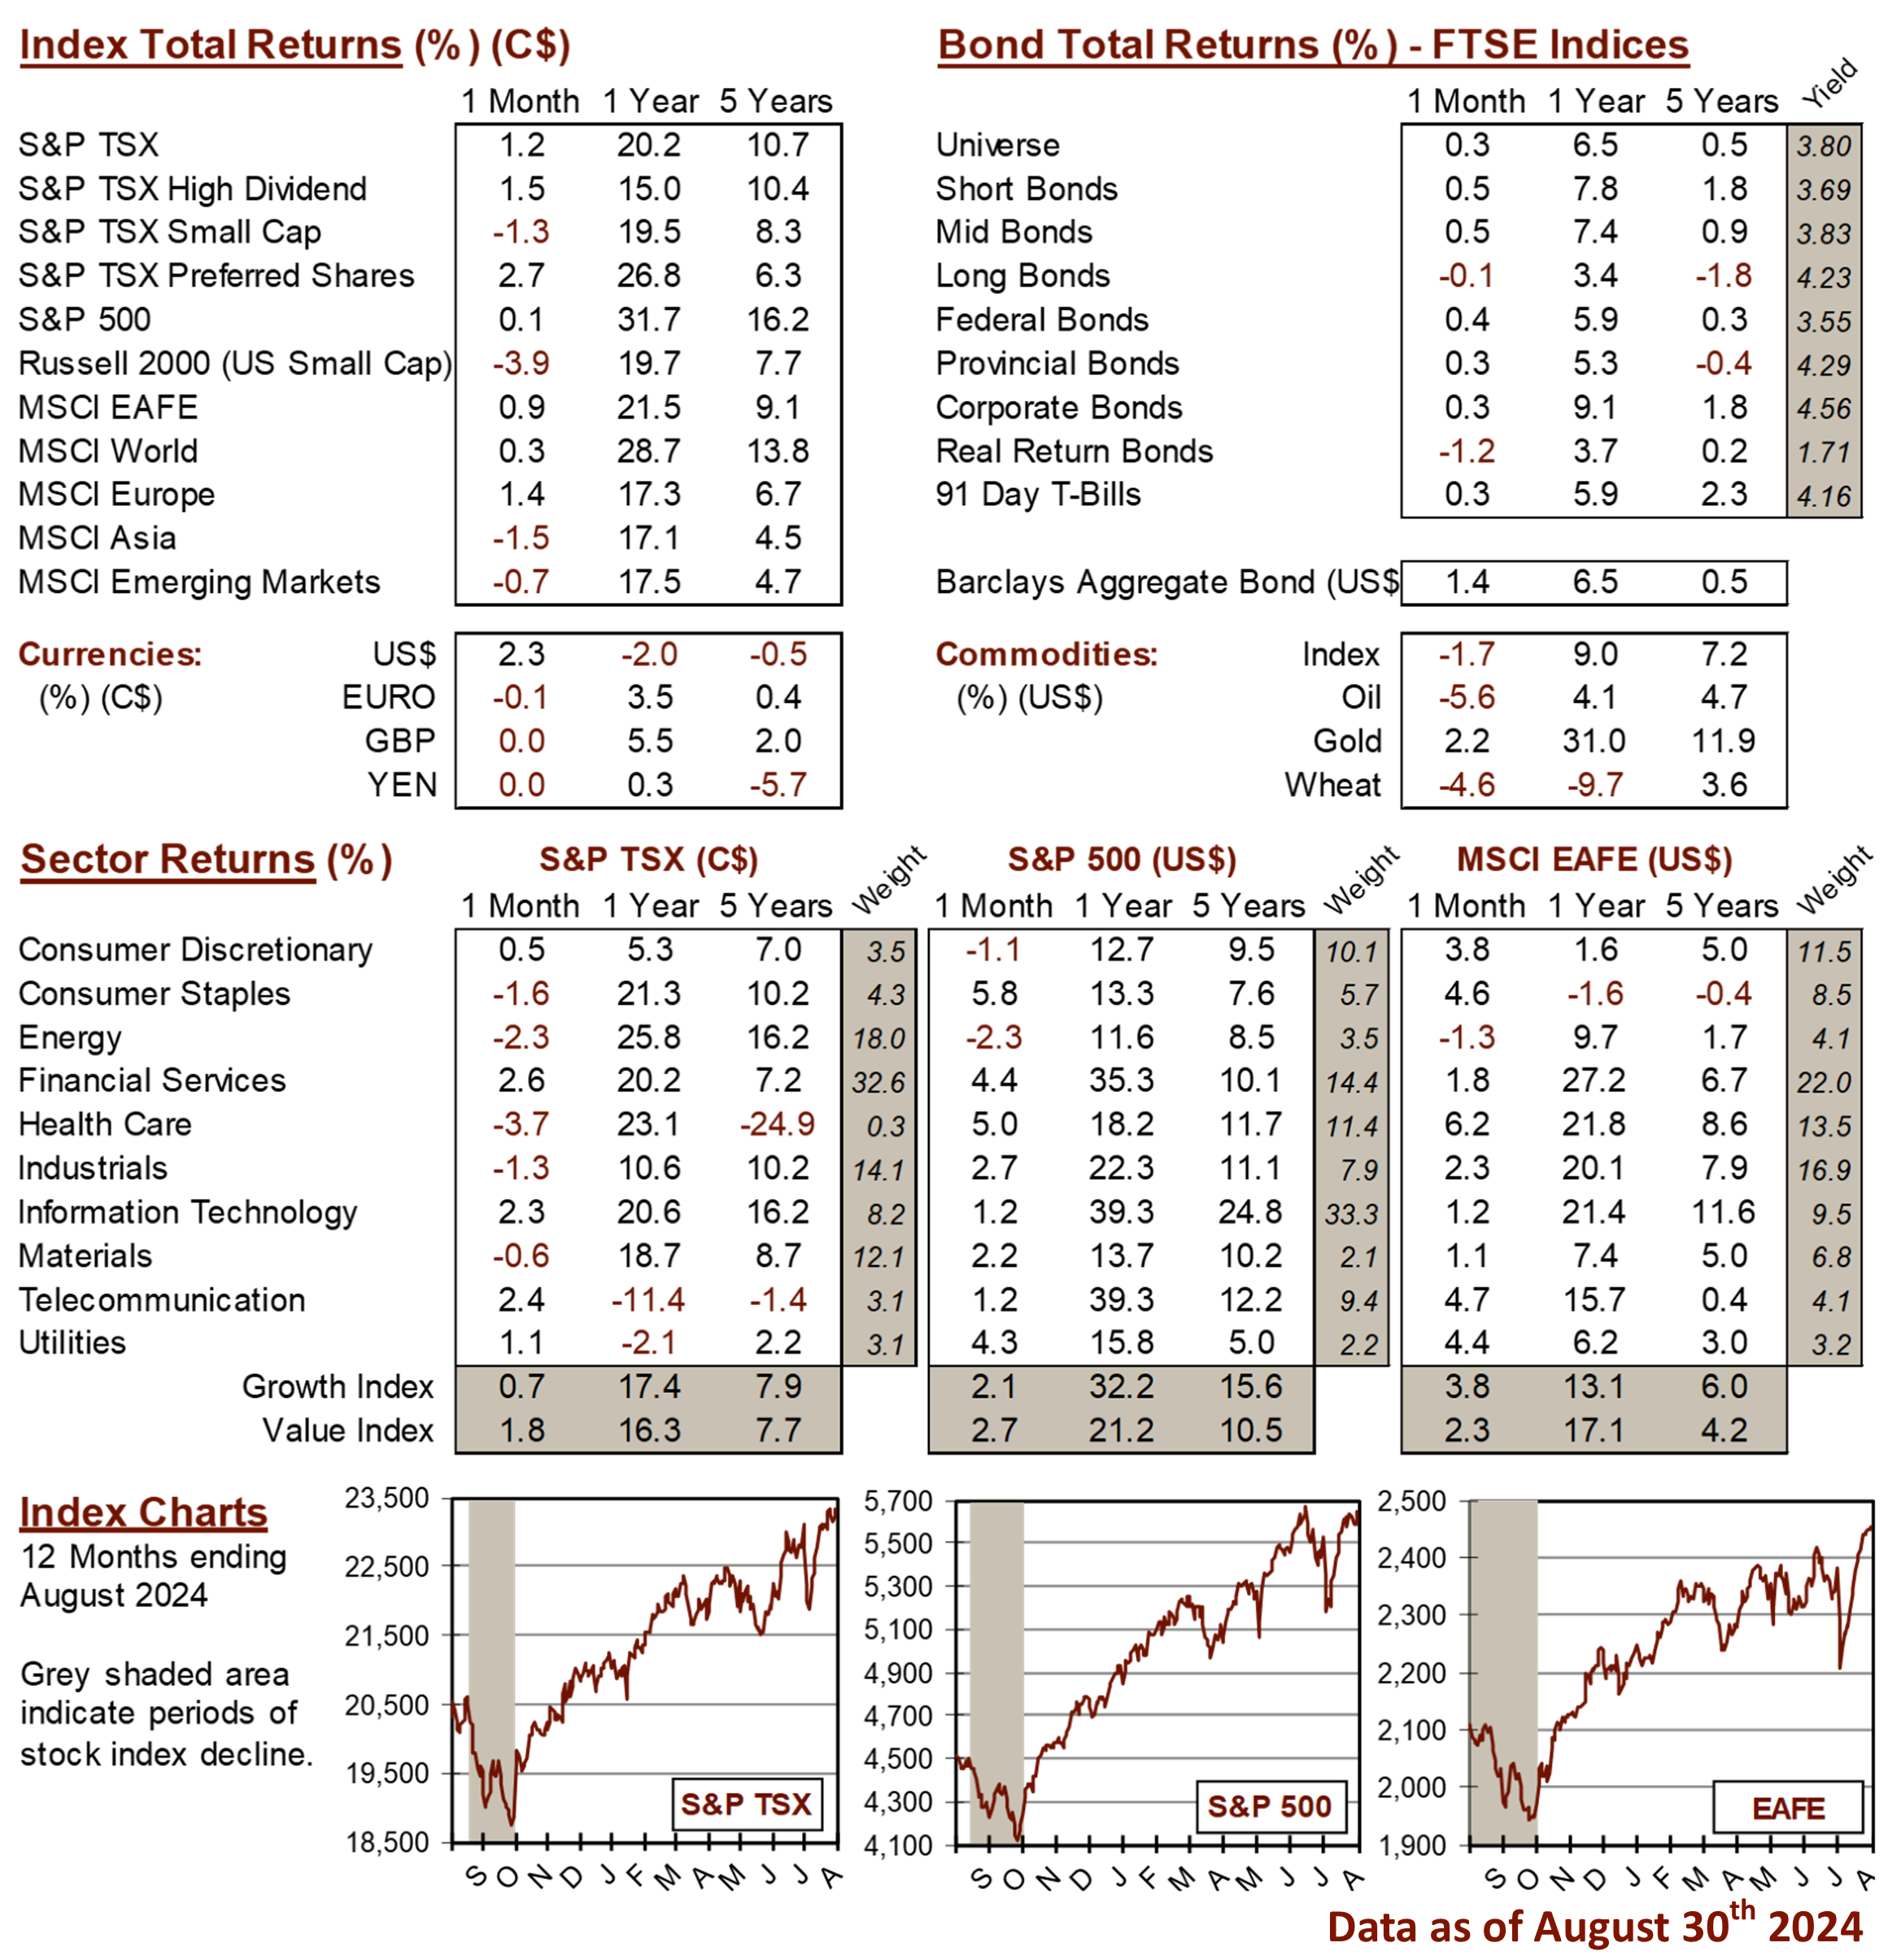
MARKET DATA

This report may contain forward looking statements. Forward looking statements are not guarantees of future performance as actual events and results could differ materially from those expressed or implied. The information in this publication does not constitute investment advice by Provisus Wealth Management Limited and is provided for informational purposes only and therefore is not an offer to buy or sell securities. Past performance may not be indicative of future results. While every effort has been made to ensure the correctness of the numbers and data presented, Provisus Wealth Management does not warrant the accuracy of the data in this publication. This publication is for informational purposes only.
Contact Us
"*" indicates required fields
18 King St. East Suite 303
Toronto, ON
M5C 1C4
